Accessing Analytics
MailCub provides comprehensive analytics and delivery logs to help you monitor, optimize, and troubleshoot your email performance. From delivery success rates to open and bounce statistics, MailCub ensures you have full visibility into how your messages perform, whether you're sending a few hundred or millions of emails.
Analytics and logs are available directly in your client dashboard, accessible from the sidebar under Email Logs and Dashboard.
1. Dashboard Overview
Once logged in, your dashboard provides a graphical summary of your email performance, including:
- Delivery Rate — Percentage of emails successfully delivered.
- Success Rate — Ratio of emails delivered without error.
- Email Statistics — Emails that bounced or failed to reach recipients.
- Tracking by Date Range — View statistics by day, week, or month.
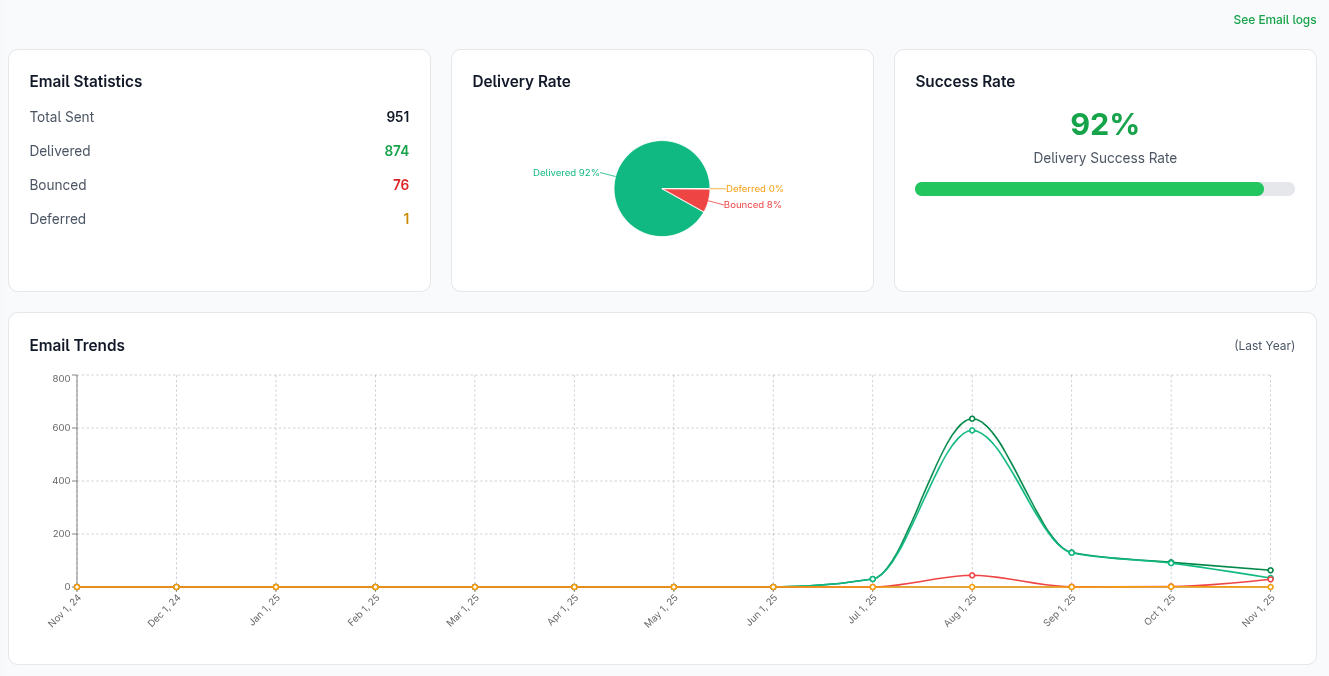
2. Filtering & Time Range
MailCub lets you filter analytics data by:
- Specific time periods (last 7 days, 30 days, or last year)
Use the filters at the top of the analytics graph to customize your reports. 
Accessing Logs
1. Email Logs Sidebar
You can access detailed delivery logs by selecting Email Logs from the sidebar.
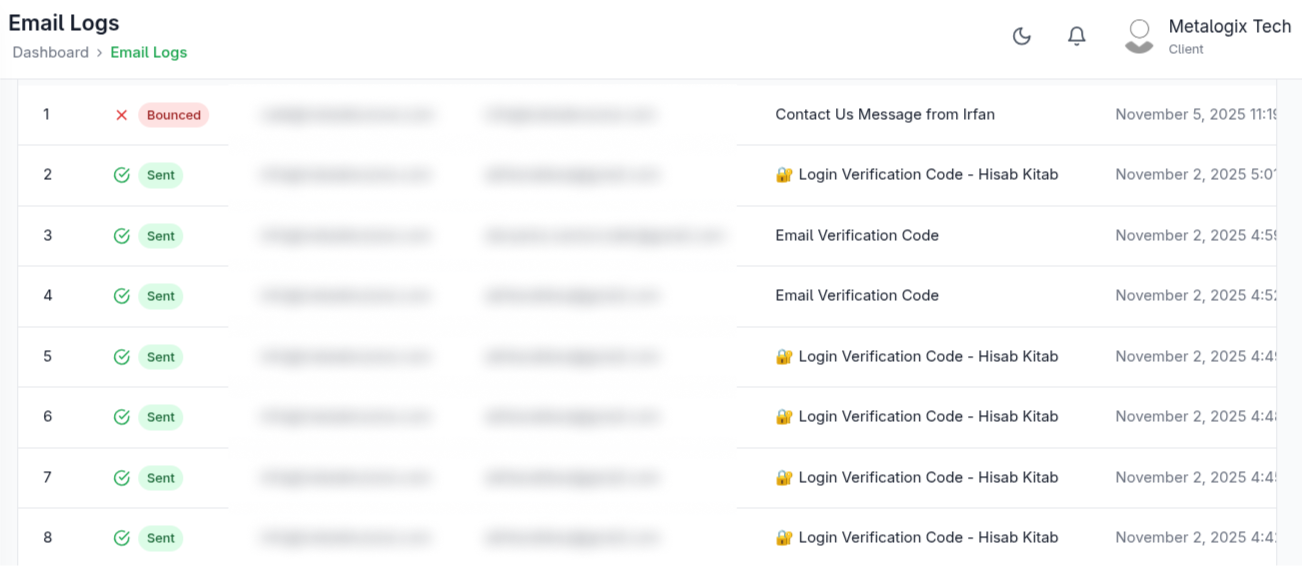
Each log entry provides:
- Recipient Email Address
- Message Subject
- Delivery Status (Success, Failed, Deferred, Bounced)
- Timestamp
- Error Message (if failed)
These logs can be filtered by date or delivery status.
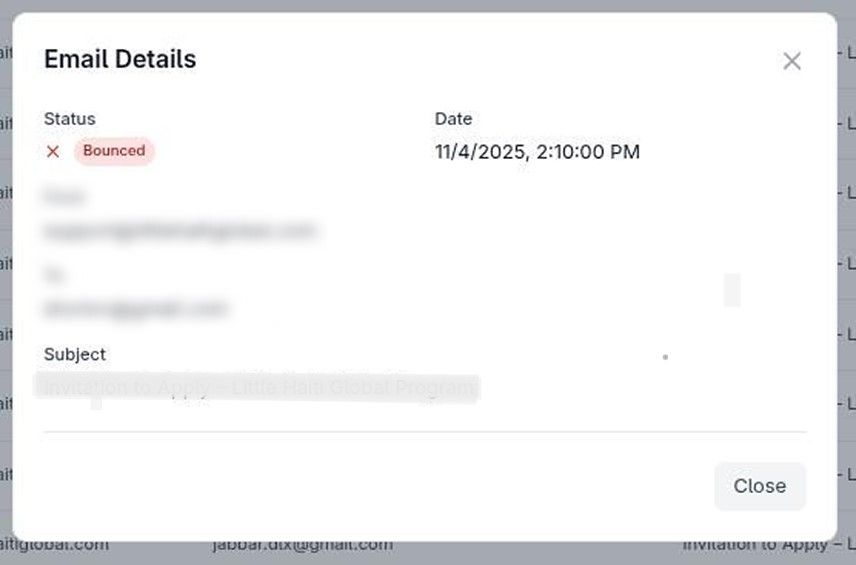
2. Viewing Detailed Log Data
To view full delivery details for a specific message:
- Go to Email Logs.
- Click on a log entry.
- A detailed panel will display:
- Message Sender/Receiver
- Delivery time
- Message ID
- Bounce or success response
Monitor Key Metrics
- Review delivery and bounce rates regularly.
- Identify domains or addresses with repeated delivery failures.
Leverage Reports
Use your analytics to:
- Improve subject lines and content strategy.
- Adjust sending frequency.
Next Steps
- Check your Dashboard for live analytics graphs.
- Review recent email logs under Email Logs.